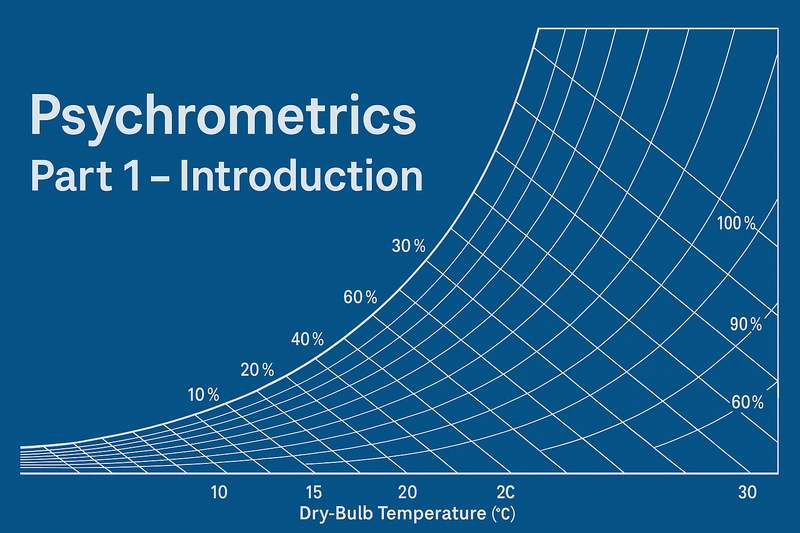
This is the first post in a four part series on psychrometrics. Even though most HVAC engineers and designers are already familiar with psychrometrics, it never hurts to have a refresher.
This post will cover the basics of the psychrometric chart as well as some fundamentals concepts, equations, and resources.
At any given moment, the state of air can be defined by its psychrometric state. The psychrometric state of air requires two inputs from the following list:
| Input | Abbreviation | Units |
|---|---|---|
| Dry Bulb Temperature | F | |
| Wet Bulb Temperature | F | |
| Relative Humidity | RH | % |
| Humidity Ratio | W | |
| Enthalpy | ||
| Specific Volume | ||
| Dewpoint Temperature |
There are a few notes to add about the table above:
Typically it is assumed that the altitude is 0 ft (sea level), since varying altitude will not have much of an impact until the altitude gets quite high.
All of these parameters really just indicate two things: the temperature of the air and the humidity in the air. Based on those two pieces of information, the total energy (enthalpy) and density (inverse of specific volume) can be determined, and thermodynamic calculations can then be performed to determine heating and cooling necessary to alter the air.
Below are some basic definitions of each of these terms in the table above:
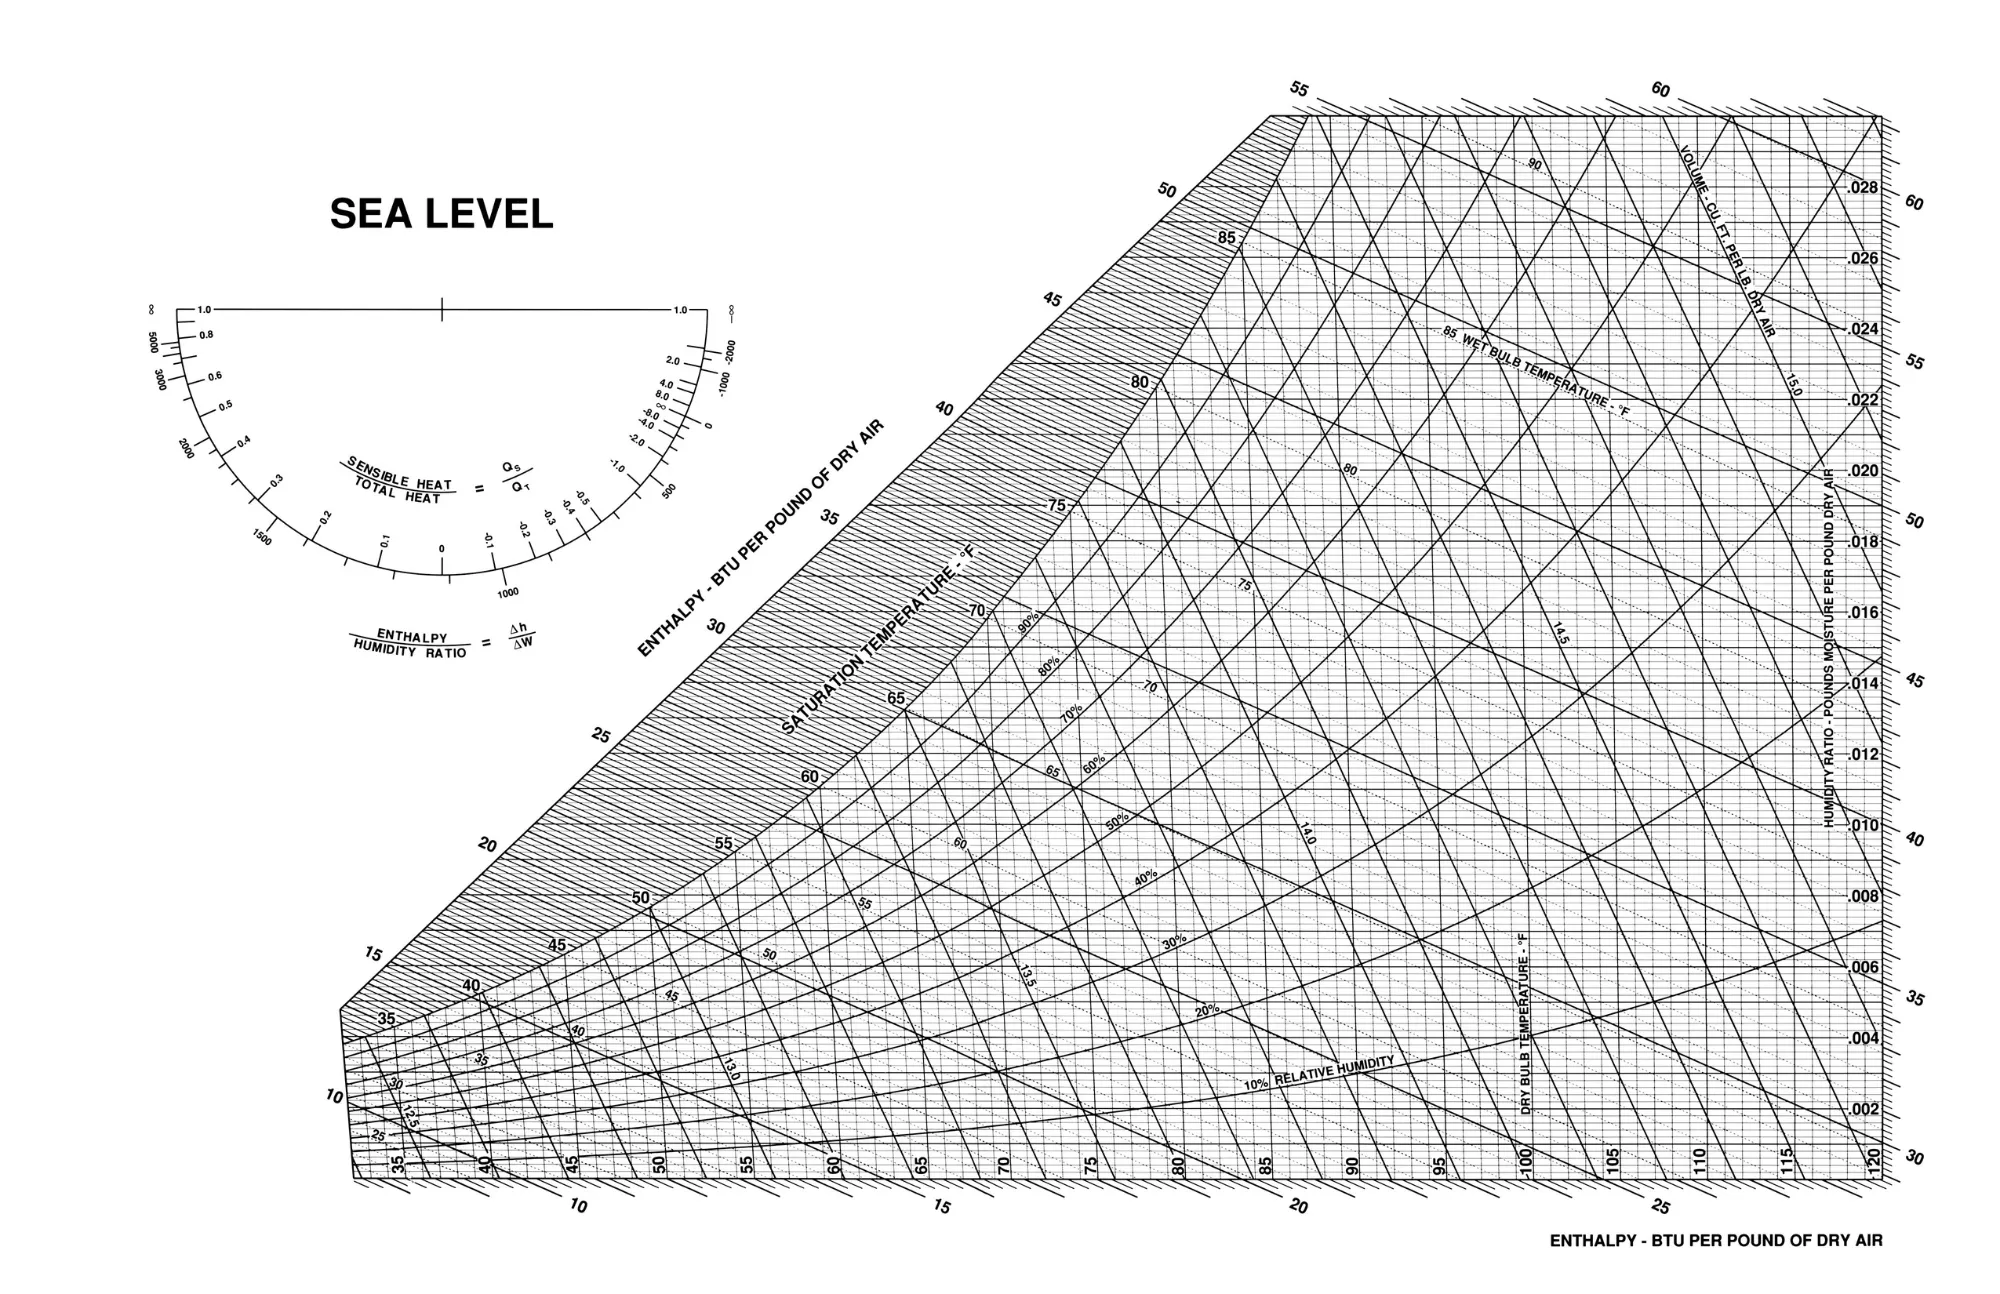
Trying to understand all these pieces of information can seem like a lot to keep track of, but luckily we have the psychrometric chart, which allows us to pinpoint all information about the air by plotting a point with only two inputs.
This chart is intimidating at first, but isn’t so bad once you’ve practised with it. The image below gives an example of a point being plotted. This point was plotted with air at a dry bulb temperature of 83oF at 40% relative humidity. The red line represents the dry bulb temperature and the yellow curved line represents the relative humidity. The point lies at the intesection of these lines, and provides us with the remaining information. The wet bulb temperature is show by the green line, the enthalpy is shown by the blue line, the specific volume is shown by the pink line, and the humidity ratio and dewpoint temperature are both represented by the orange line. Notice that the blue and green lines are almost exactly the same - if you look closely at the psychrometric chart you’ll see that wet bulb temperature and enthalpy lines are almost parallel, but at just a slightly different slope.
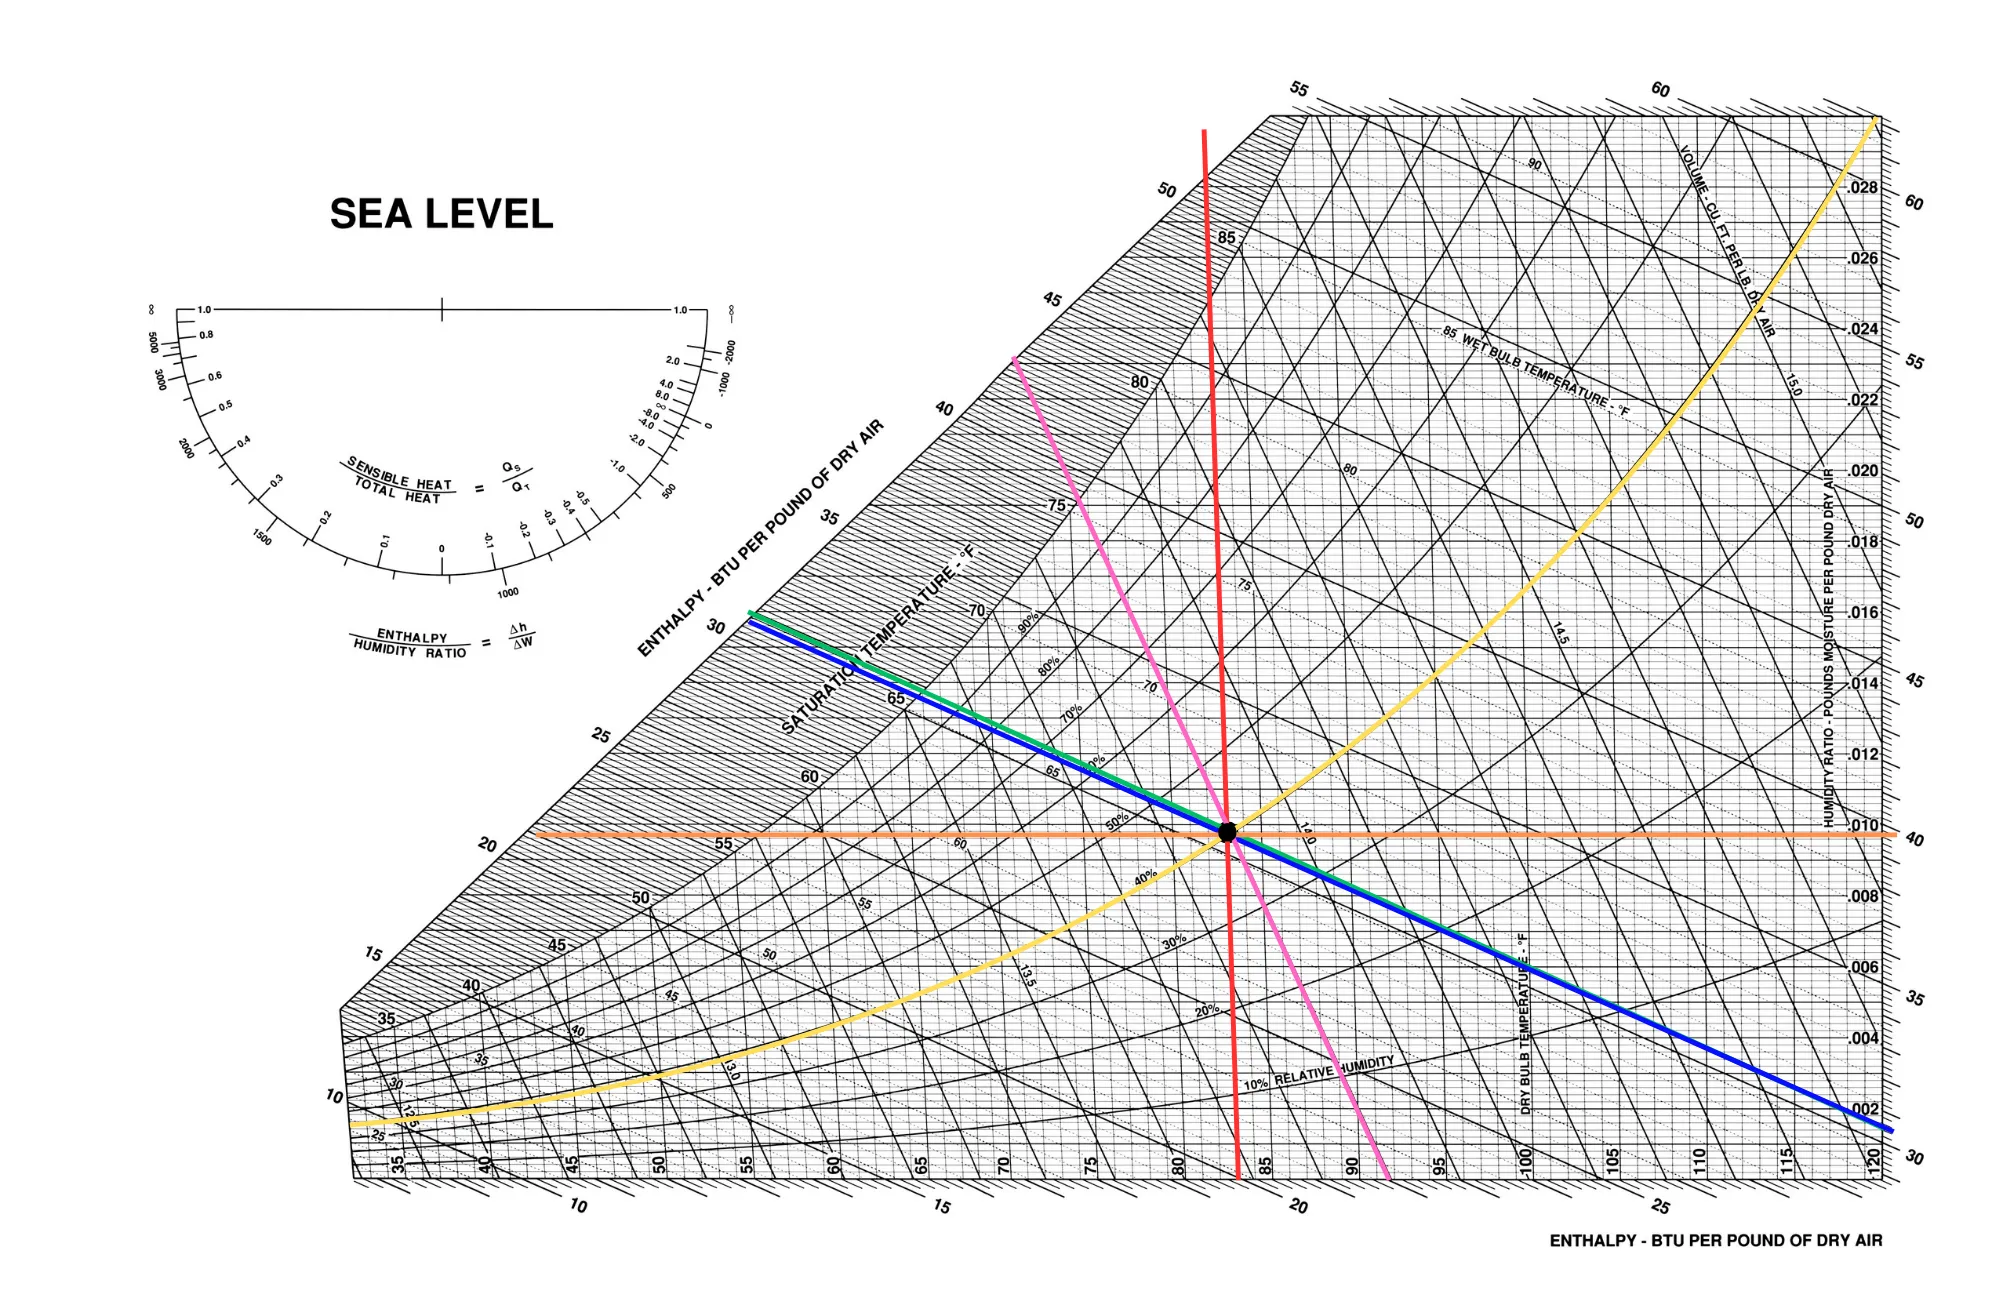
The values of this point are:
| Variable | Quantity | Units |
|---|---|---|
| 83 | F | |
| 66 | F | |
| RH | 40 | % |
| W | 0.010 | |
| 31 | ||
| 13.9 | ||
| 56.5 |
Notice how we could have arrived at this point by using the dry bulb temperature along with the wet bulb, enthalpy, humidity ratio, or specific volume. By knowing just two pieces of information, the rest can be determined by plotting the point on the psychrometric chart. Also notice the words “Sea Level” in the top left corner. As altitude changes, the chart will change as well. Most engineers will just use the sea level chart unless the location under consideration is at high altitude, in which case there are alternative charts such as the 5000ft chart. The 5000ft chart is commonly used for places like Denver where the elevation will make a noticeable difference and can no longer be ignored. The reason for this difference is due to the lower density and pressure of the air, altering the specific volume and the ability for water to evaporate, causing the relationship between enthalpy and humidity to change.
Air exists at some psychrometric state based on temperature and humidity. That psychrometric state is usually described by the dry bulb and wet bulb temperatures, but can be fully determined by any two values from the list above. The state of air can be easily visualized by plotting the point on a psychrometric chart.
Although these values can be determined by using a psychrometric chart, that is not the only way to find the values. Chapter 1 of the ASHRAE Fundamentals Handbook gives all the necessary equations to calculate values given two inputs. HeatWise also offers a full psychrometric calculator, including elevation adjustment. Just log into your account, and on your main page of projects scroll to the bottom and click Psychrometrics Calculator.
In Part 2 of this blog post we’ll go over the various psychrometric processes and how they look on the psychrometric chart.